
Login/Register
Airports and Airlines: Who Needs Whom? Evidence from LatAm/Caribbean
Patrick Lucas
Rafael Echenvarne
November 1, 2026
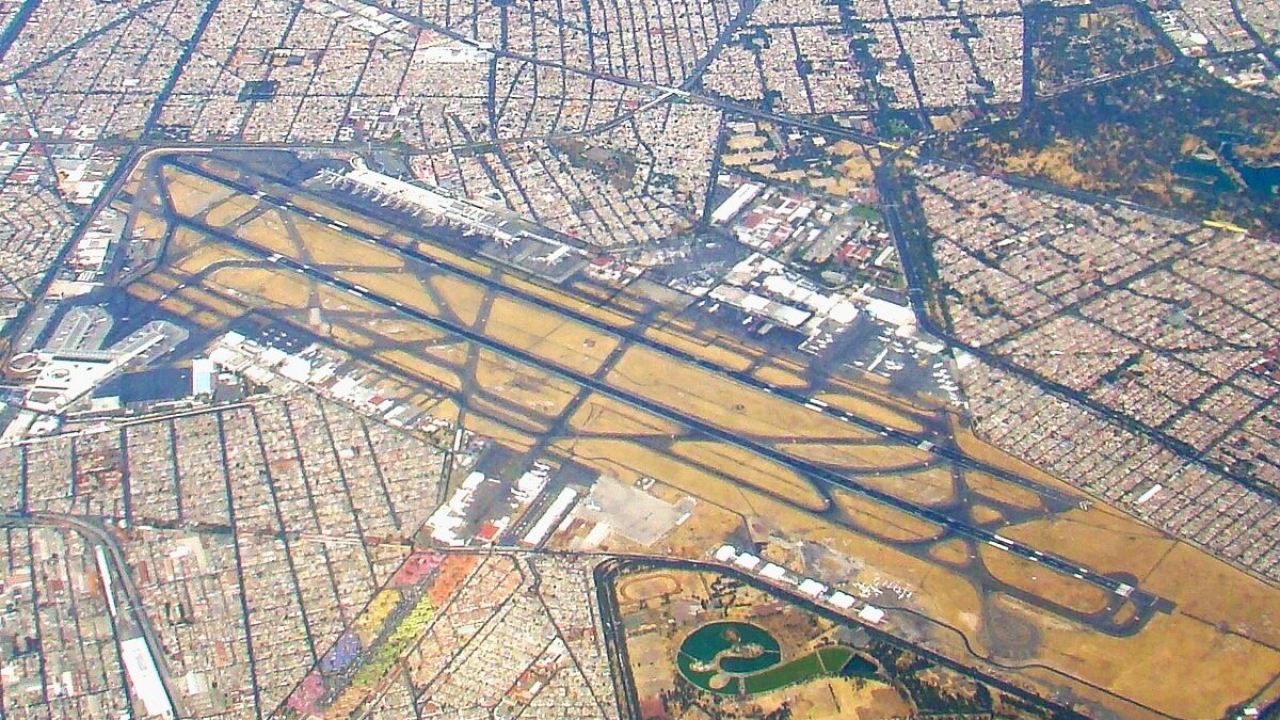
Highly constrained Mexico City Airport (MEX) is the least airline-dependent among LatAm's top 30.
© Norman L. Cullen / Wikipedia
Debates about airport charges often begin with a familiar assumption: airports are monopolies, and airlines have little choice but to accept their terms. Analysis of Latin America and the Caribbean (LAC) suggests a more complex relationship. Many airports depend heavily on carriers whose aircraft and investment can move elsewhere. This matters in a region where 81% of air passengers travel through airports with private-sector involvement.
Sustaining infrastructure investment over a long time horizon requires a credible opportunity to recover operating and capital costs, including financing costs, plus a reasonable return commensurate with risk. Understanding airport-airline bargaining power is therefore essential.
Market Power Has Two Sides
A monopoly is a market with one seller, while a natural monopoly arises when one provider can serve demand at a lower total cost than competing providers.
Airports’ substantial infrastructure costs and economies of scale can support this characterization, but being the sole airport serving a locality does not automatically confer significant market power. The relevant question is whether an airport can profitably sustain charges above competitive levels or impose less favorable commercial terms despite the risk of losing traffic.
Airports compete to retain airline services and attract additional routes and capacity. Connecting hubs compete for transfer passengers, while airports with overlapping catchments may compete for travelers originating in or visiting the same region. On some routes, there are alternative modes of transport as well.
Power also exists on the purchasing side. Countervailing buyer power arises when customers can resist a supplier’s terms through credible alternatives, or the commercial importance of their purchases. A monopsony has one buyer; an oligopsony has several buyers. A dominant carrier’s presence alone does not establish monopsony, and competition among airports for airline capacity can strengthen buyer power by widening carriers’ alternatives.
© Airport Economics Consulting/ACI-Latin America-Caribbean
LAC Shows an Unequal Dependence
Analysis of scheduled traffic in Latin America and the Caribbean (LAC) identifies 554 airports in 2025, compared with 146 marketing airlines (which sell the flight tickets) and 183 operating airlines (which fly the aircraft). Almost 60% of regional scheduled seat capacity is attributed to just six marketing airlines. These perspectives should remain distinct when measuring concentration. Although regional concentration figures alone do not establish bargaining power at individual airports, they provide context for examining dependence between airports and their principal airline customers.
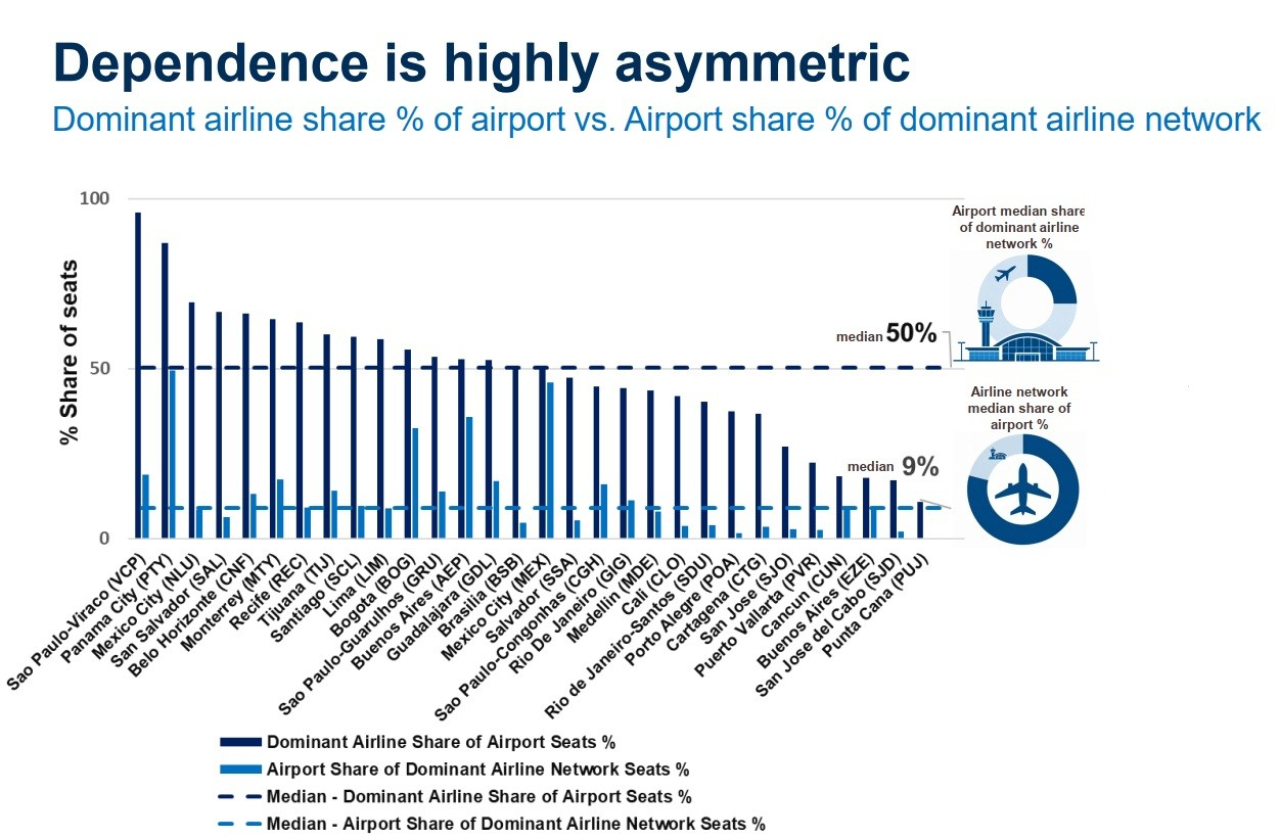
A central question is: how costly would it be for an airport to lose its leading airline, compared with the cost to that airline of reducing or relocating operations? Across LAC’s 30 busiest gateways, the dominant airline accounts for a median 50% of seat capacity, while an airport represents a median 9% of its dominant airline’s network (median = the middle of a distribution). These findings suggest that airports are more exposed to their leading carrier than that carrier is to any single airport.
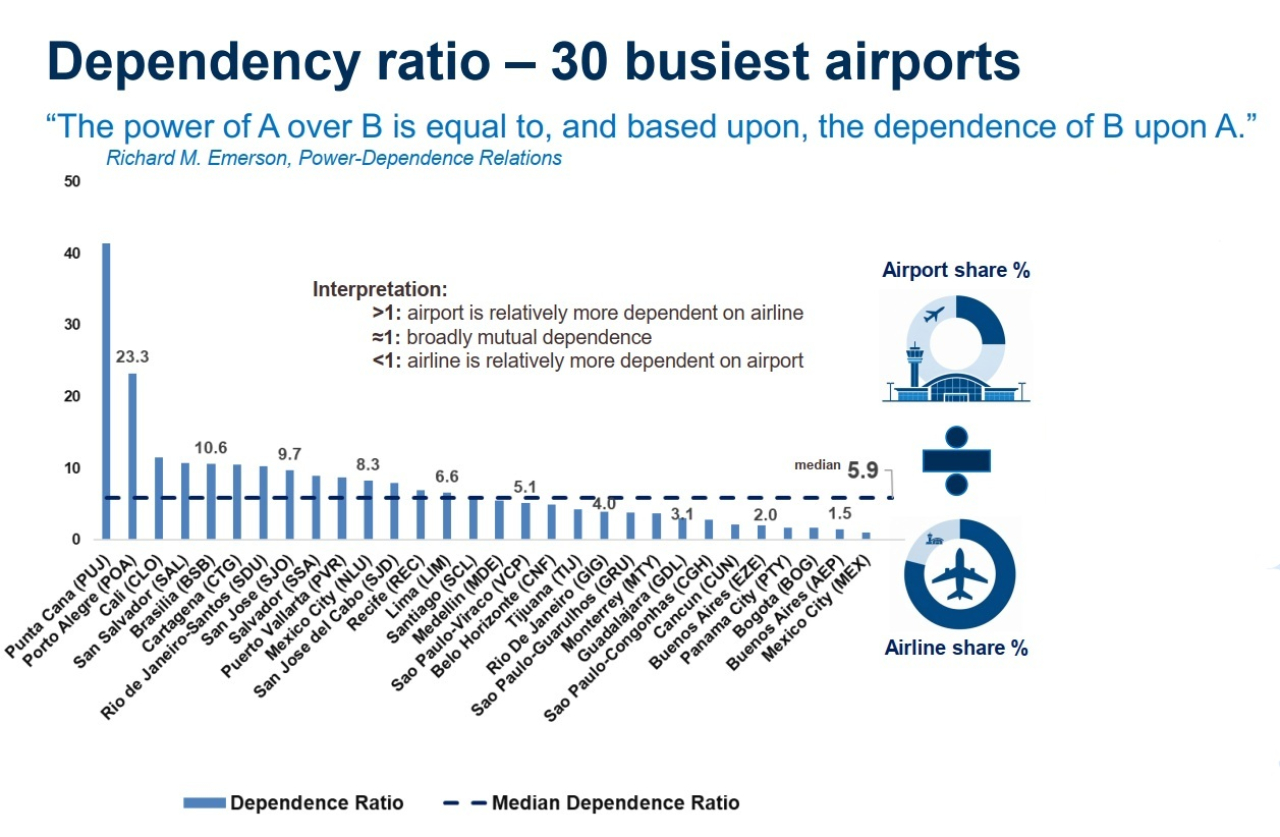
A dependency ratio quantifies this asymmetry. If an airline supplies 60% of an airport’s seats but the airport represents 10% of its network, the ratio is six. This means that for a typical LAC airport, the airport is approximately six times more dependent on its leading carrier than that carrier is on the airport.
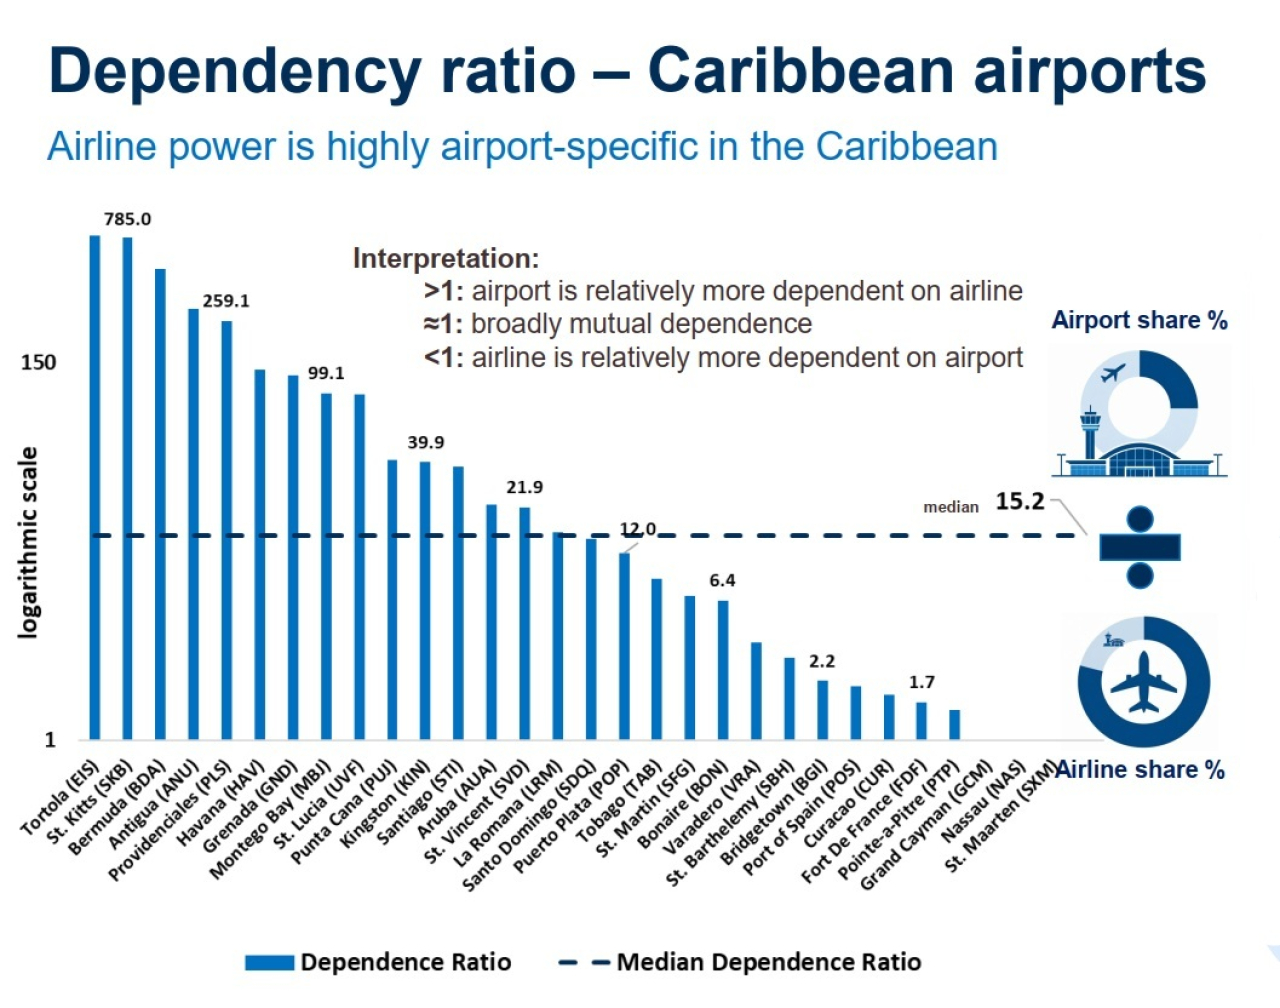
Across the 30-airport sample, the median of the individual ratios rounds to six, with outcomes ranging from broadly mutual dependence to above 20. Among Caribbean airports, the median reaches 15. These figures indicate relative exposure, not proportionately greater bargaining power.
© Airport Economics Consulting/ACI-Latin America-Caribbean
Aircraft Can Move, Runways Cannot
Airport finances make this exposure consequential. LAC data for 2024 show aeronautical activities (such as aircraft and passenger charges) accounted for 64% of revenue, non-aeronautical for 26%, and non-operating sources for 10%. Commercial activities like retail and parking depend on passenger flows. Losing a major airline can therefore affect several revenue streams.
The cost breakdown shows 60% operating expenditure and 40% capital costs. The latter are largely fixed in the short term, while many operating costs are fixed or semi-fixed, adjusting only partially as traffic changes. Airports incur substantial costs to maintain operational readiness even when traffic declines, with only the variable portion responding directly to activity. Many infrastructure investments represent sunk costs: expenditure that cannot readily be recovered by withdrawing from the market. These characteristics limit an airport’s ability to cut costs or redeploy assets when an airline withdraws.
This matters for private-sector participation. Investors and lenders commit capital against expectations of future cash flows. Cost recovery provides the foundation for financing infrastructure over its useful life, and if commercial pressure persistently prevents that recovery, investment may become less attractive or more expensive.
© Airport Economics Consulting/ACI-Latin America-Caribbean
Airline flexibility has limits. A strategically important hub, strong local demand or scarce slots may make withdrawal expensive. Slots are permissions to use airport infrastructure for an arrival or departure at a specified time. An airport’s ability to attract replacement services can also strengthen its negotiating position.
Concentration measures add context. The Herfindahl–Hirschman Index (HHI), a measure of market concentration, indicates values below 1,500 as low, 1,500–2,500 as moderate, and above 2,500 as high concentrations. Using the four-firm ratio (the combined share of the four largest suppliers (CR4)), the corresponding bands are below 45%, 45–60%, and above 60%. These indicators describe market structure rather than establish market power.
At LAC airports below one million passengers, the leading airline holds 99% of flights, with an HHI of 9,711 and CR4 of 100%. Where these smaller airports have few realistic opportunities to attract alternative carriers, they may possess little effective market power. Instead, bargaining power can lie overwhelmingly with airlines, whose movable aircraft can be redeployed elsewhere. Such concentration may reflect limited demand rather than anti-competitive conduct, but it can nevertheless leave smaller airports highly dependent.
Evidence-based Oversight, Stronger Connectivity
These findings have four key implications. First, economic oversight should assess both airport market power and airline buyer power. Buyer pressure can encourage efficiency, but where it prevents recovery of costs, it may weaken airports’ ability to finance and develop infrastructure.
Second, competition requires meaningful market access. Restrictive bilateral air-service arrangements can constrain traffic rights expansion, shielding incumbent carriers from potential competitors. Liberalization can open doors for new entrants and allow existing airlines to expand routes and frequencies. Greater competition can encourage lower fares, better service and wider passenger choice, while improved connectivity supports tourism, trade and broader economic development.
For airports, a more diversified airline customer base also reduces dependence on a dominant carrier. These benefits depend on commercially viable demand and effective access to airport capacity, making liberalization and transparent slot allocation complementary priorities.
Third, effective slot governance matters where capacity is scarce. Based on airlines’ shares of total flights, the LAC analysis finds a median HHI of 3,502 and a dominant-carrier share of 53% at Level 3 airports, which require coordinated slot allocation. Corresponding figures at Level 2 airports, where schedules are facilitated, are 3,116 and 43%. Both groups exhibit high concentration under the thresholds used in this analysis. Where strong incumbent positions coincide with scarce capacity, limited access to commercially attractive slots can make entry or expansion difficult.
Policy should preserve operational predictability while promoting efficient capacity use and access for new entrants and expanding competitors. This requires transparent allocation criteria and effective monitoring of slots. Airport operators should play a leading role in assessing available airport capacity in coordination with airlines, air navigation service providers, and slot coordinators.
Finally, the public debate should consider the full range of factors that shape air connectivity. Airport infrastructure costs, including ATC, account for approximately 5.5% of airline costs in the region, providing important context when assessing claims that infrastructure charges constrain growth. Such claims should be evaluated alongside passenger demand, airline concentration and bargaining power, airlines’ aircraft deployment decisions, and the investment needed to maintain and expand airport capacity.
An automatic presumption of airport market power risks placing undue regulatory constraints on airports without accounting for the competitive pressures and bargaining dynamics across the aviation sector. A balanced approach to economic oversight should consider the commercial realities facing both airports and airlines. Asking who depends on whom provides a stronger foundation for proportionate regulation and sustainable infrastructure investment.
[Data sources and methodological notes: The airline market structure analysis draws on scheduled passenger flight and seat capacity data from Cirium Schedules (2026) for the year ending December 2025. The 2024 airport financial indicators are drawn from the ACI Airport Economics Key Performance Indicators (2026).]