A Year Like No Other: the Drivers Impacting Aviation in 2020 (Part 1 of 2)
Catherine Harmel-Tourneur
May 26, 2021

|
In this two-part article, the traffic forecast advisory arm of airport research consultancy DKMA offers essential and detailed insights on the way air travel demand has changed due to the COVID19 pandemic. The first part provides an overview of air travel coming into 2020 and the impact of the pandemic last year, and part two will focus on the medium-term outlook. |
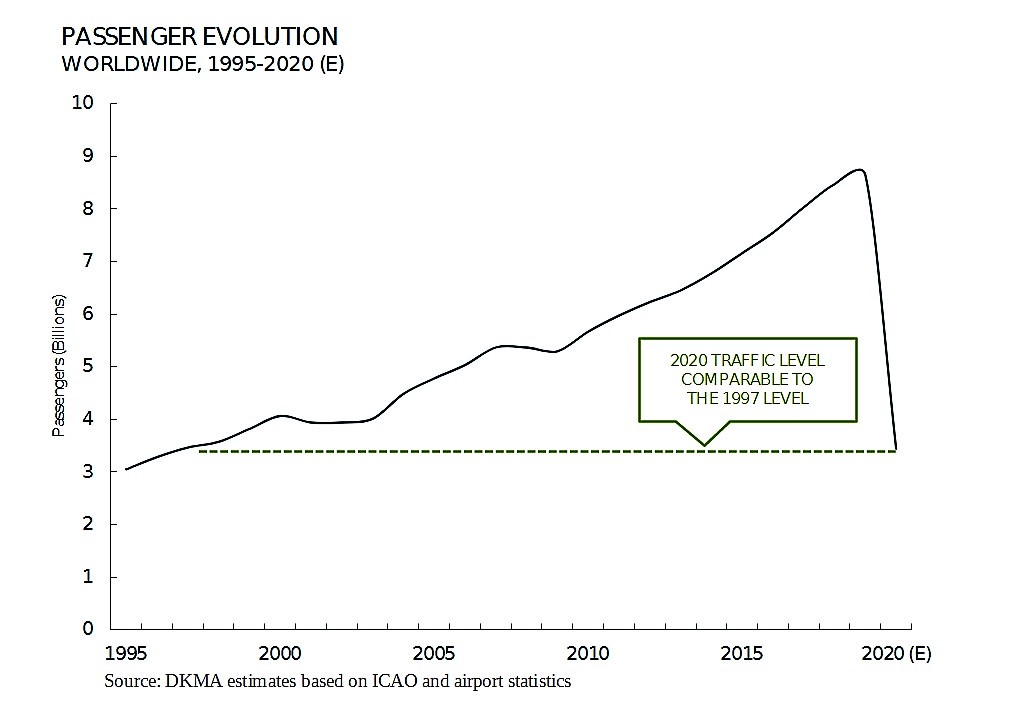
Over time a number of significant developments have impacted the air transport industry affecting its shape and direction. Between 1995 and 2019 global passenger demand nearly tripled, led by, among other things, globalization, emerging economies and low-cost carrier development. Prior to 2020, the last industry downturn was the 2009 Global Financial Crisis, but starting in 2010 the industry enjoyed nearly a decade of unabated growth (see chart below right).
Over the years, fueled by global exchanges and tourism, international markets expanded more rapidly than their domestic counterparts and by the end of 2019, over 40% of all passengers flew on international routes.
While it is well understood that the air transport industry is cyclical by nature, the current downturn is unprecedented in its duration, scope and magnitude.
Stay-at-home orders imposed by various governments as well as closures of international borders have resulted in an estimated decline of over 60% of passengers in 2020. These traffic levels are comparable to those experienced in 1997. That was the year when Hong Kong returned to Chinese rule from the UK, Princess Diana died in Paris, and the Kyoto protocol on climate change was signed.
While all regions, routes and airports were impacted by the crisis some fared better than other.
Last year’s decline can be explained by several factors, the overriding one being international border closures and/or quarantine rules. As a result, roughly 25% of total passengers flew on international routes.
Domestic routes were not immune but they held up better and became a form of refuge for some. Last summer, for example a sizeable number of citizens took ‘stay-at-home vacations’. However, both in terms of volume and revenue, domestic trips were not nearly enough to compensate for the collapse of international markets.
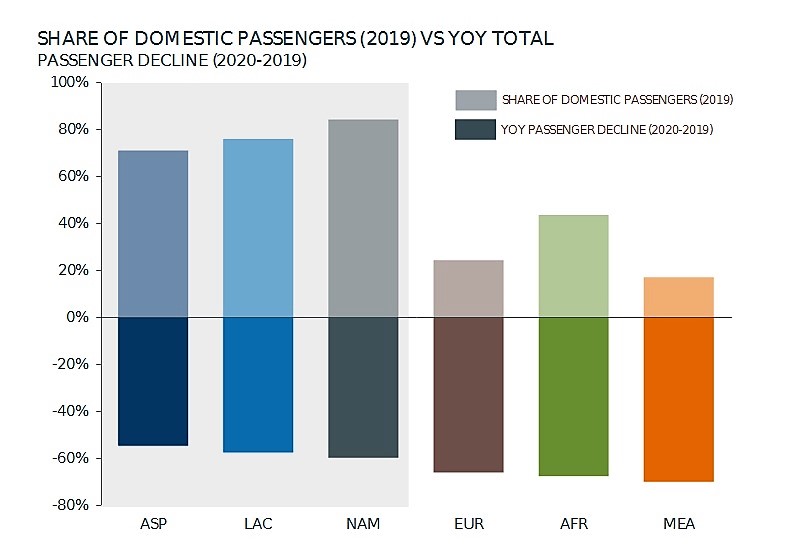
Last year, all regions experienced a significant decline in demand and, not surprisingly, it stung more in those regions with a greater reliance on international passengers. The Middle East, given its geographic location and aggressively-growing long-haul carriers, was one of the most dynamic regions. Over recent years it has seen the development of some of the largest international hubs.
However, in 2020 these advantages became weaknesses as most long-haul routes came to a halt or were significantly scaled back. At the other end of the spectrum, Asia-Pacific performed the best. Many countries in the region – for example China and Australia – controlled the pandemic relatively well. This enabled them to rely on their large domestic markets which translated into a less severe traffic decline compared to other parts of the world (see chart above).
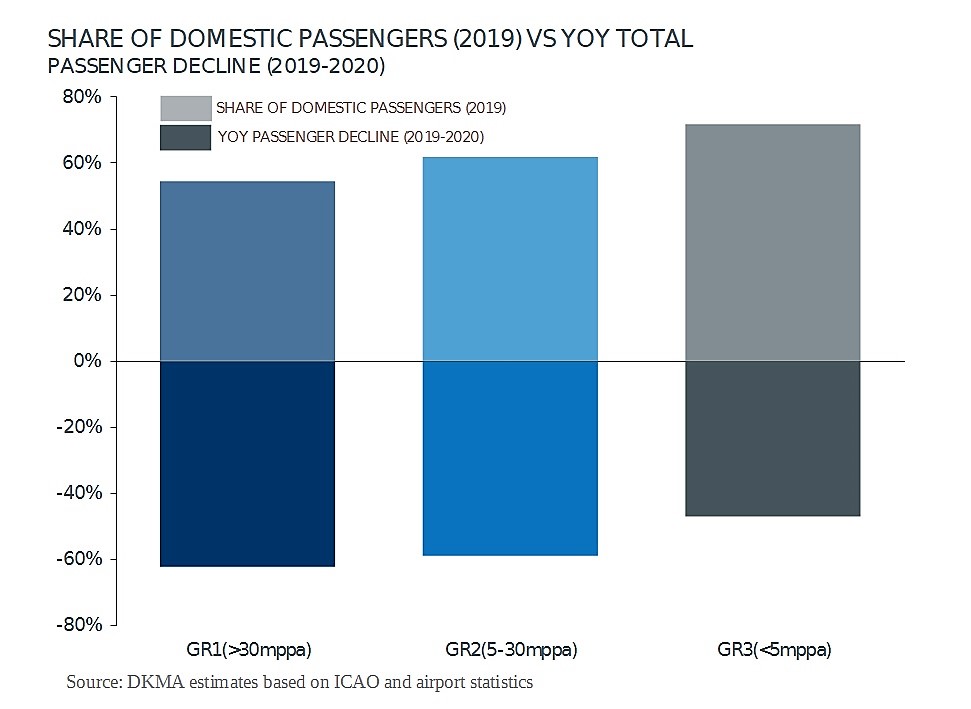
At an airport level, large ‘hub type’ airports, which typically rely more on international markets than smaller airports, experienced a greater decline in demand last year.
Yes, new routes did open in 2020
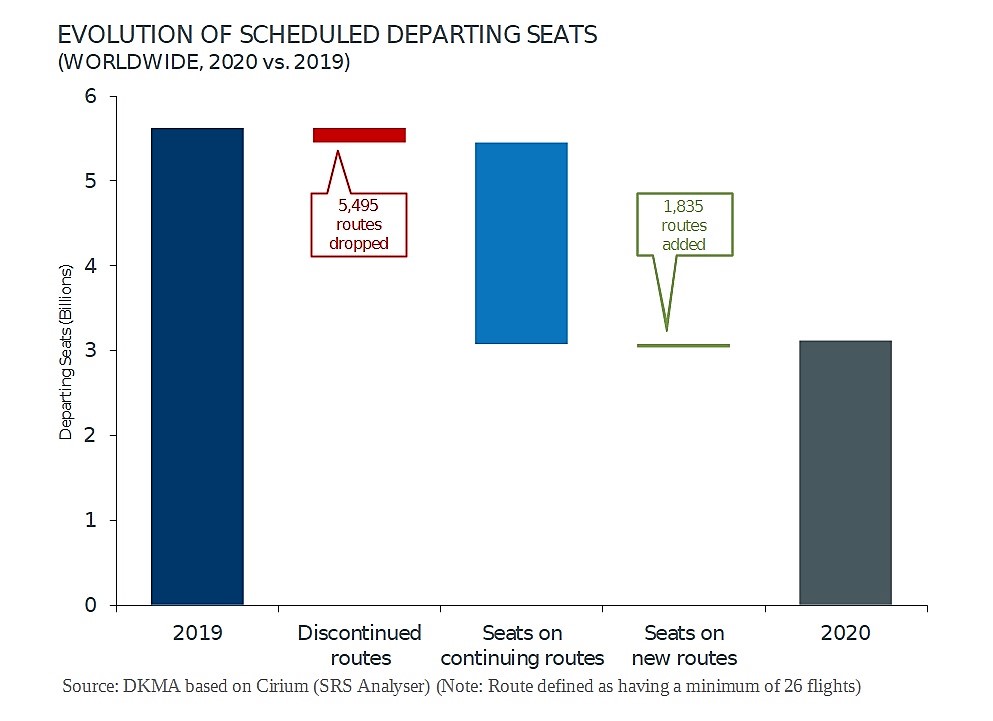
Despite the difficult operating environment, 1,835 routes were launched last year of which 1,242 were domestic. In total they accounted for 1.3% of the total departing seats in 2020. Most routes added were in Europe and Asia with low-cost carriers operating several of them. Three elements help explain this route expansion:
- growing demand, for example in the Chinese domestic market
- predictions of a 2020 second half recovery from some experts (which turned out not to be the case)
- some carriers were/are determined to emerge from the crisis in a stronger position.
In parallel, 5,495 routes were dropped (nearly 4,000 of which were international) and as can be seen in the graphic (below), typically carriers continued to operate most of their routes albeit at a very reduced capacity and at a significantly reduced frequency. As a result, average daily flights fell by nearly 35% last year.
 Faced with the collapse of passenger demand carriers had to quickly adjust and adapt. Between 2016 and 2019, on the heels of expanding international networks, the average stage length and aircraft size increased. The collapse of international demand translated in a reduction of the average stage length and, while all types of passenger aircraft were grounded last year, a greater share of them were wide-bodies (e.g., A-380s and classic B-777s) or replaced by smaller wide-bodies such as the B-787 or A-350.
 The effect of these changes has been a reduction in average seats per flight. Furthermore, if we split the metrics between domestic and international, we note that last year the average aircraft size and average stage length went up domestically, but went down internationally.
Many challenges lie ahead, such as the emergence of new COVID19 variants, but the rollout of mass vaccination programs leads us to believe that, with time, the air transport industry will rebound.
[A Year Like No Other Part 2 was published on June 2, 2021]


