Two Graphs Say It All: How Major Canadian Airlines Have Fared Through the Pandemic
Frode Skulbru
November 25, 2020

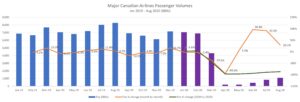
Last week, airportIR published an article predominately focusing on the U.S. market and how the number of passengers is increasing despite the growth in COVID-19 cases. You can read that article here. Since many businesses fell off the proverbial cliff in March this year, we have seen numerous statistics and figures related to the dramatic change in business fortunes. In this article, we present two graphs that illustrates how dramatic the impact has been on the Canadian aviation sector. The first graph depicts passenger volumes as carried by major Canadian airlines per month from January 2019 until August this year.  Source: Statistics Canada. Table 23-10-0079-01 Operating and financial statistics for major Canadian airlines, monthly Through 2019 we see a customary seasonal pattern with July and August as the busiest months of the year (blue bars). January and February 2020 (purple bars) were better than the previous year, although there were signs of an economic correction of some sort during the end of 2019 and beginning of 2020. By the end of April 2020, passenger volumes had dwindled to a mere 3.1% of what it was in February – a 96.9% decline in less than sixty days – from 6.9 million to 213,000 passengers. Immediate changes to number of flights and seat supply followed, some voluntary out of necessity but many forced as borders closed and international travel dwindled toward zero. Since then, the passenger numbers have slowly grown throughout the spring and summer. The two busiest months of the year – July and August – were both down 89.5% and 86.8% respectively compared to 2019 (month-to-month growth were naturally high as the base was so low). Passenger volumes is one metric however the next graph depicts how the changes impacted reported revenues.
  As expected, the graphs look very similar. Load factors were high through 2019 at 84.2%, dropping to 64.6% in March before collapsing to 26.0% in April. Since then, the airlines have adjusted their supply in an attempt to bring profitability up on the flights that actually operate. As a result, load factors have started climbing, but at 48.8% in August, these are a far cry from what is necessary to operate profitably over a longer period. As passengers disappeared, so did revenues. During the two-month period from March 1st to end of April, revenues declined 90.2% from $1.8 billion to $180,000. Revenues per passenger were on average $295 in 2019. During the first eight months of 2020, the average had increased to $509, likely a reflection of lack of seats during the early stages of the pandemic, hence fares were increased. Statistics for May indicate average revenues of $1,135 per passenger. As a somewhat temporary new normal took hold over the summer, average revenues for July and August were $330 per passenger. The same period of 2019 generated $320 per passenger. For the eight months ending August 31st, total revenues stood at $6.6 billion compared to last years $17.3 billion – a 62.2% decline. Ignoring January and February as these performed per the old normal, 2019 generated $11.4 billion in 2019, dropping 88.5% to $1.3 million in 2020. During this period, Air Canada have laid off 20,000 employees, amounting to more than 50% of its workforce. It may also be forced to cancel some aircraft orders, including the Quebec made A220, if the industry’s fortunes do not turn around soon or the government does not support the industry. WestJet today announced in the spring that 6,900 staff would be leaving the organization. The airline had approximately 14,000 employees before this announcement. The federal government has rolled out several programs offering liquidity and loan guarantees, such as the large employer emergency financing facility (LEEFF) and the business credit availability program (BCAP), which are offered to a variety of sectors. Prime Minister Justin Trudeau has not directly addressed a bailout of the beleaguered industry but has said he plans to keep working with airlines hit hard by the pandemic. One may be for or against a cash refund of pre-paid tickets, but given the above bleak picture, one can understand that every dollar counts in order to keep the companies solvent and able to continue operations. In early November, Air Canada reported third quarter 2020 negative EBITDA, excluding special items, of $554 million compared to third quarter 2019 EBITDA of $1.472 billion. This resulted in an operating loss of $785 million in the third quarter of 2020 compared to operating income of $956 million in the third quarter of 2019. Note that this comes after a $1.5 billion cost cutting exercise. Unrestricted liquidity amounted to $8.189 billion on September 30, 2020, hence the carrier has funds to sustain losses for another few months. Please return to this space as we will update the figures with additional months as they become available.
