COVID-HQ: The Economy, GDP and the Impact on the Recovery of Passenger Volumes
Frode Skulbru
July 2, 2020

____simple_html_dom__voku__html_wrapper____>
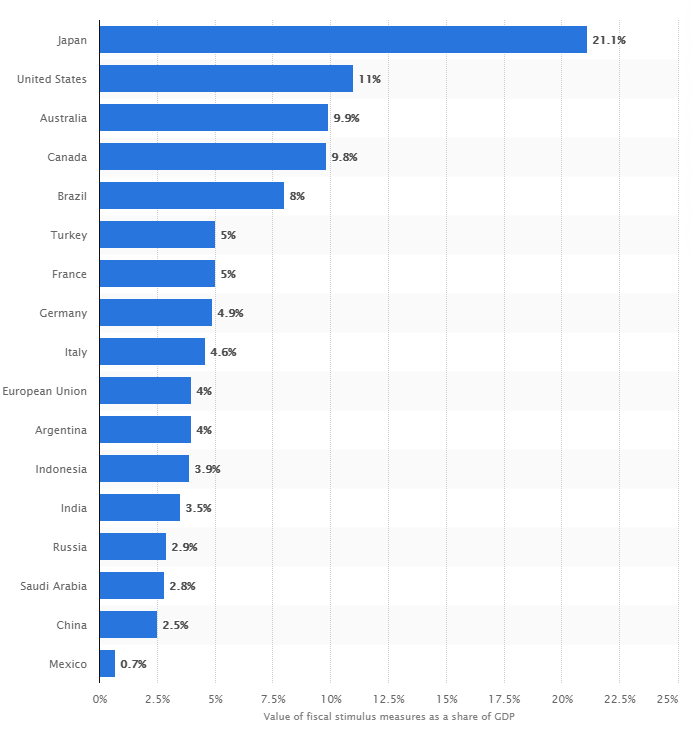
Now that we are or are about to enter the re-opening phase in parts of the world and some airline capacity have been increasing over the last few weeks, we wanted to take a look at the economy at large to assess or pose some questions around the same to see if we can extract some signs that support various types of recoveries, be it V, L, W, U, hockey stick (if you are Canadian) or any combination of the above. In this article, we have focussed on the U.S. market only as firstly; it is the largest economy in the world and secondly; information is plentiful and easily available. Given the global nature of the crisis, the same issues would however be applicable to many other geographical regions. Here at AirportIR, we cannot claim we are experts in macro economics or what drives the market, so we have instead compiled a number of facts, ask the questions and let you, the reader, think about what the likely outcome will be. Economic Fundamentals One thing we do know is that in the longer term, the propensity to travel is highly correlated to actual GDP and GDP growth. 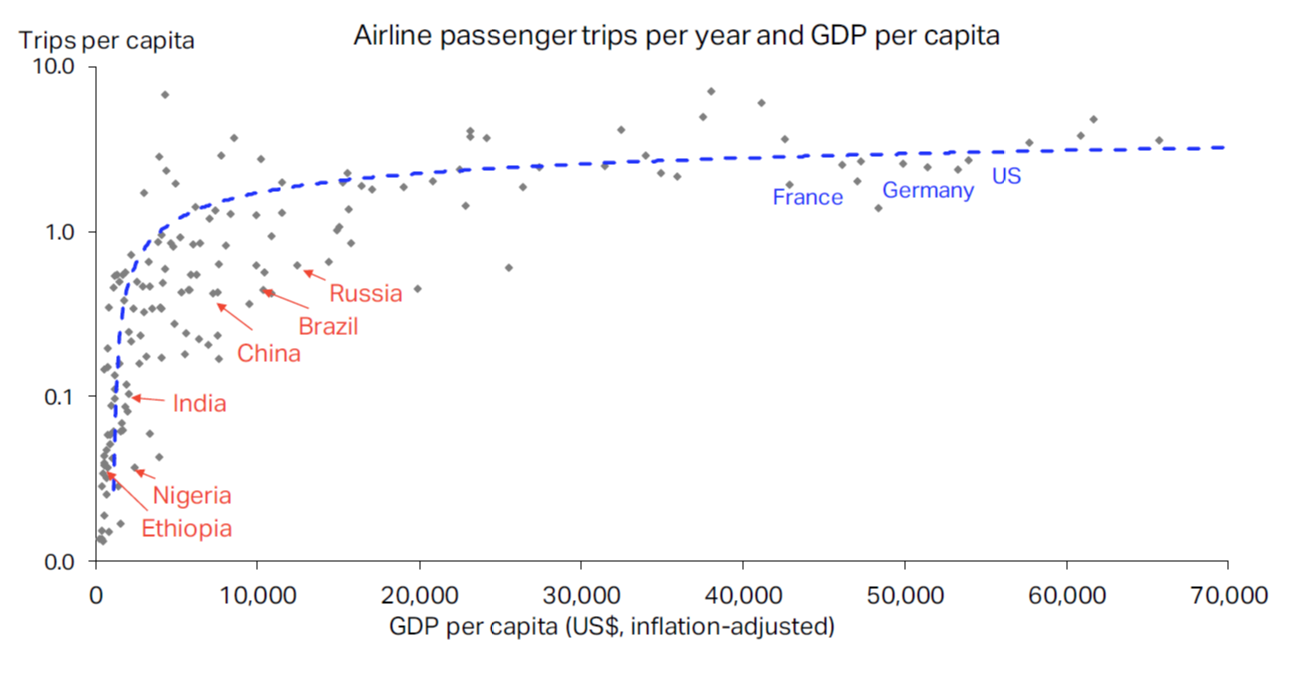 Source: IATA The higher the GDP, the higher the number of trips per year. GDP also have a multiplier effect on travel, with 1.0% growth in GDP resulting in 1.0% to 2.0% growth in number of trips (more on this at the end of this article). It is therefore prudent to speculate how the GDP will develop over the next few quarters. An early indication for Q1 is that the US GDP declined by 4.8% as reported in mid-April. Citigroup estimates that 95% of the activity that drives GDP is under “stay at home” orders, which creates difficulties collecting all data in a timely manner. It is therefore likely that this number will increase once the full picture emerges. This is common, but under normal circumstances the adjustments are not too material. Note that this is for Jan-Feb-Mar only, i.e. before the full effect of COVID-19 came into effect. Very strong stimuli through increased public debt and increased money supply are limiting the immediate effect of the pandemic. Globally, governments have increased their debt by about $16 trillion (with a T) by end of May. To put this into perspective, global new debt tends to average around $7 trillion per year. The U.S. alone has added around $3 trillion as part of the recovery package. Treasury Secretary S. Mnuchin stated that the country will likely need more (funding for stimulus packages). The total stimulus package in its various forms equates to a massive 11% of the U.S. GDP, only exceeded by Japan at 21.1%.
  Source: Statista State of the Economy
- Unemployment: 38 million (!) people are considered unemployed in the U.S. by mid-May.
- Consumer Spending: While the Chinese economy is to a large extent driven by manufacturing, the U.S. economy is driven to a large extent by consumer spending. According to a CNBC report, 67% of GDP is related to consumer expenses. Retail itself makes up 10% of direct employment and supports 25% of total employment, which in the U.S. equates to somewhere around 42 million people.
- Supply Chain Disruptions: With the world’s economies in various states of closure, there has been an impact on the various supply chains. China haled its production machine from mid-January (Chinese New Years) and did not fully open again until the country claimed control over the pandemic. Initially, existing inventory around the world absorbed the lack of new goods but this will be somewhat out of sync as the various countries opens and closes at different times. The U.S. – China trade disputes do not improve matters.
- Decline in Commodity Prices: Lower commodity prices drives investments in various sectors down. A continuous dispute over oil production does not help, however with the economy in slow motion, the demand is and will be lower than normal, theoretically driving prices down.
A few bullets as reported by Forbes further paints a pretty bleak picture:
- Six million homeowners were past due on their mortgages as of the end of April, the largest number since January 2015, according to a report from Black Knight, a mortgage technology and data provider.
- The national delinquency rate nearly doubled to 6.45% from 3.06%, which also represents a record increase (almost three times the previous single-month record set back in late 2008.)
- An additional 2.4 million workers filed for temporary unemployment benefits in mid-May (bringing the nine-week total to more than 38 million), with 47% of adults reporting that they or another person in their household has lost income since mid-March.
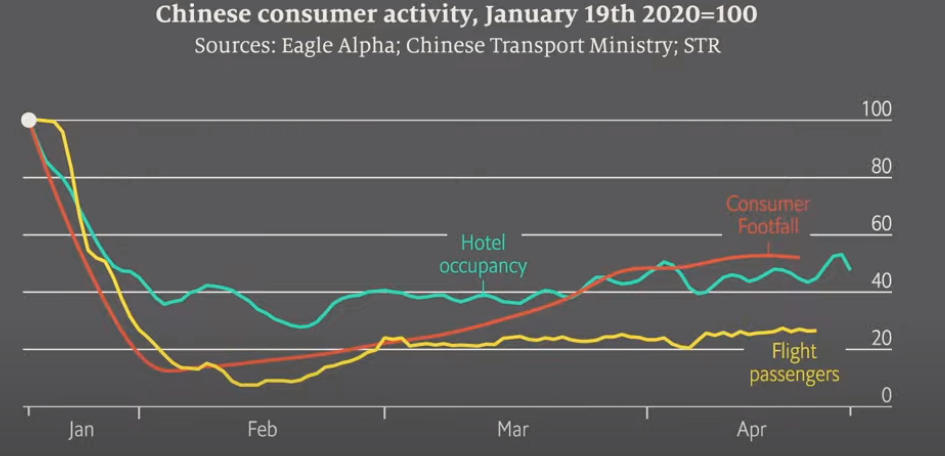
All in all, the above alone may dictate a recession type environment for some time to come. Job creation for May was announced last week and was (unexpectedly) positive. The data released from the Department of Labor’s Bureau of Labor Statistics (BLS) indicated that 2.5 million jobs were added in May. Unfortunately, again as reported by Forbes, it now looks like the jobs report has been inaccurate for the last two months. BLS has admitted that government household survey takers mistakenly counted about 4.9 million people as employed, although they were unemployed. Had the mistake been corrected, the unemployment rate would have risen to 16.1% in May. The corrected April figure would have been more than 19.5% – rather than 14.7% (the official response was that the government doesn’t correct its survey results for fear of the appearance of political manipulation). The graph below compiled by the Economist says is all. 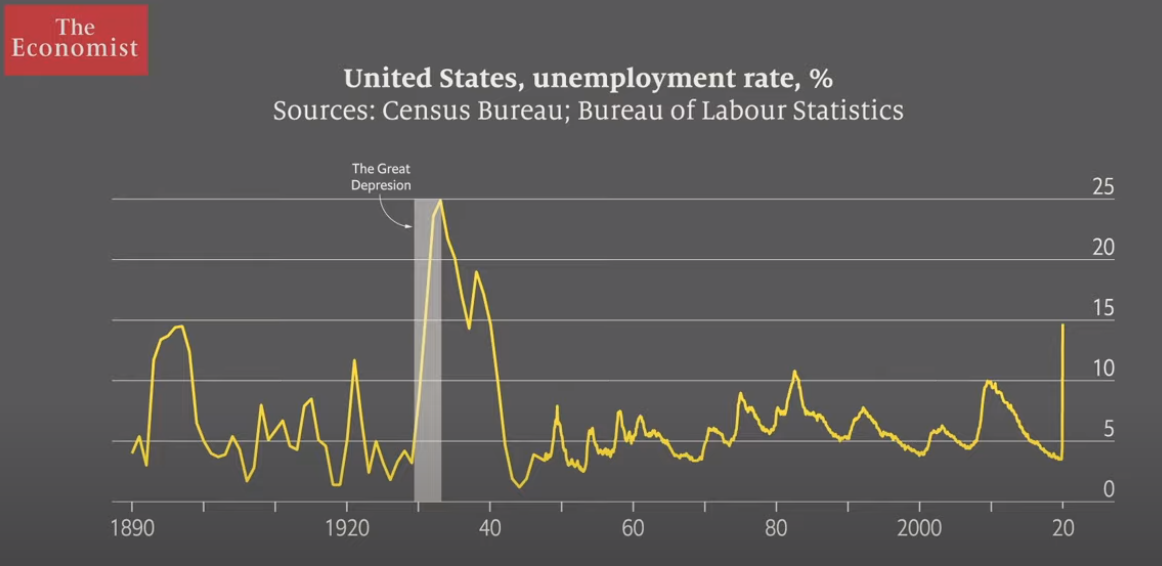 Source: The Economist China China has been touted as the economy with the most advanced recovery as they went through the pandemic cycle first. The manufacturing and other parts of the business may have recovered, but if we look at travel and consumer activities, these are by no means back to normal. Passengers at the end of April were still only about 20% of the early January numbers as measured in the index below. Consumer footfall, i.e. people visiting stores had recovered about 50%.
  Source: The Economist The Stock Market In our article on June 8, we reported that a number of aviation stocks have recovered a substantial stake of what was lost in March, albeit without having solid growth data to back this up. The overall market as measured by the large indexes (i.e. S&P 500 etc.) have recovered remarkably well in a perfect V shape.
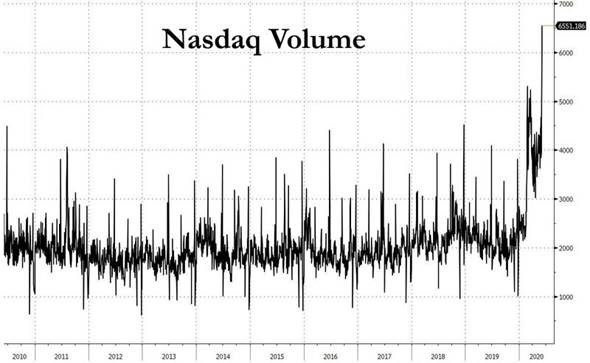
 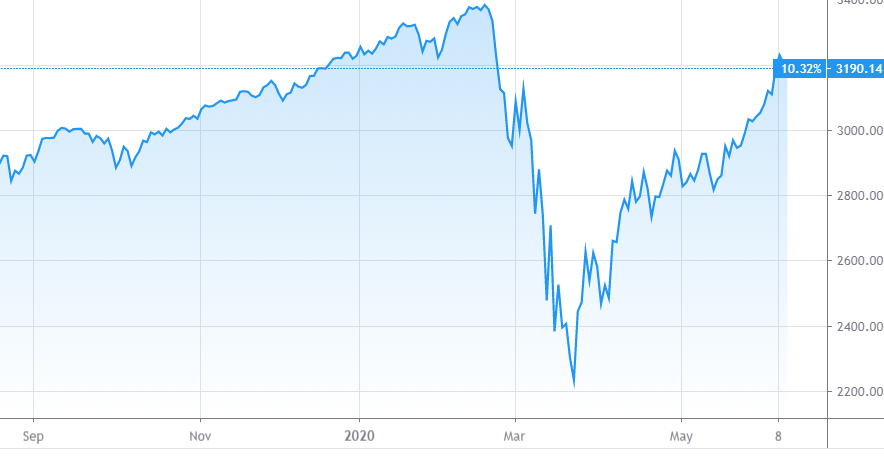 Source: TradingView Why is that? A few plausible explanations: The massive fiscal stimulus has dampened the effect of partially closing the economy. The trillions of dollars injected into the economy has skewed the underlying effect of the pandemic and helped soften the fall-out to date. While required and welcomed, the so- called free market is now on hold as all the Government interventions take effect. Since mid-March, close to 800,000 people have created new brokerage accounts on three of America’s top brokerage platforms since the coronavirus pandemic hit the US. Grandma and Grandpa are back in the market, along with their millennial grandchildren. In fact, the NASDAQ daily volume has reached a new record high, set by a wider margin of traders than ever before.
  Source: Wealth Research Group Although initially led by the mega caps and technology stocks (the big five or FAANG refers to Facebook (FB), Amazon (AMZN), Apple (AAPL), Netflix (NFLX) and Alphabet (GOOG)) reflects 20%-25% of the S&P500. The impact on the value of aviation companies can be described in this example: The US Global Jets exchange-traded fund (ETF), ticker JETS, posted its 64th consecutive day of inflows on las week, according to data compiled by Bloomberg. Its growth has been staggering: The ETF held just $33 million in early March as the coronavirus pandemic grounded global air travel. The fund’s top holdings are the four major U.S. airlines, though it said last week that it will begin investing in Canadian carriers as well. Much of that explosive growth in assets can be credited to day traders looking to “catch the bottom” in airline stocks, according to Frank Holmes, chief executive officer of JETS issuer U.S. Global Investors. After speaking with newly minted JETS holders, he says the boredom of being stuck at home and the strong rebound in carriers after the 2001 terrorist attacks and the 2008 financial crisis are luring young traders. Back to Fundamentals No matter how the volatility, the bulls and the bears and the Corona virus behaves in the short term, the long-term fundamentals will prevail. Desire: Travel is a derived demand. Very few flies for the sake of flying, but rather for what lies at the end of the flight. The pandemic is blocking this now, but once under control people will travel again. In that sense, one can argue that there is substantial pent up desire to travel once this is over. Ability: No matter how much we desire to travel, the financial reality for people may or may not allow as much traveling as we want, which brings us full circle back to the GDP multiplier as a measure of travel growth. This multiplier is not constant over time and across regions of the world. Supply of affordable travel (i.e. LCCs) will drive it up, but in a mature market with limited ability to increase infrastructure capacity and consolidated airlines (like the US), we may see a lower multiplier. The demand side is of course equally, if not more, important. Population growth, a growing middle class and a myriad of other factors will affect growth rates. In the graph below, the worldwide GDP multiplier is compared to overall GDP growth and passenger growth on an annual basis. While the multiplier may have reached 2.0 in 2016 and beyond, it was substantially lower during the Great Recession of 2008-09.
 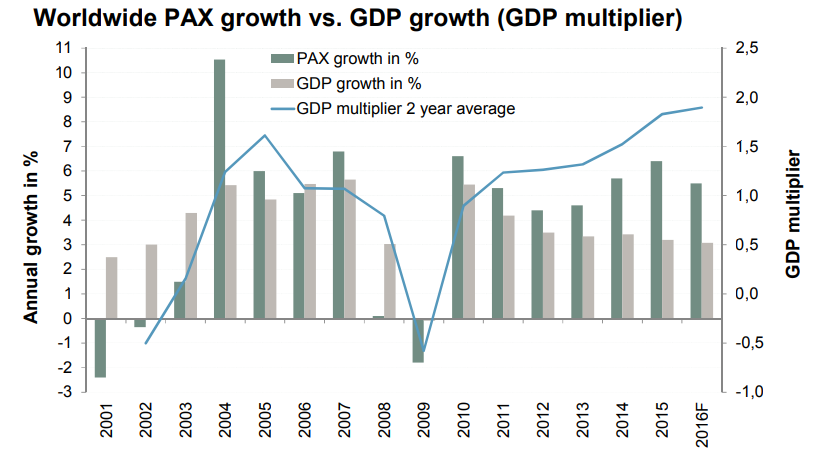 Source: ACI, IWF, KfW, IPEX Bank In the short term anything can happen, but the pandemic, closed borders and passenger sentiments toward travel will dampen volumes. In the longer term, the industry is likely to fall back to fundamentals, i.e. do people have the requisite income and free cashflow to spend on travel. Stock market highs or not, the economy on the streets will determine that. (Weekly articles related to a select group of aviation assets can be found here)
